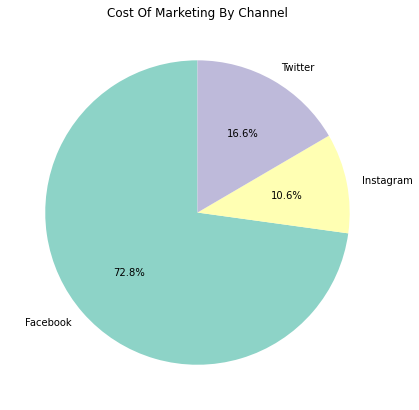
The pie chart representing the marketing costs for Recko's product across three social media channels – Instagram, Facebook, and Twitter – provides valuable insights into the allocation of resources in their marketing efforts.
The pie chart showcases the distribution of marketing costs across the three social media platforms:
Facebook
Facebook has the largest slice of the pie, accounting for 72.8% of the total marketing costs. This indicates that Recko has invested a significant portion of its marketing budget on advertising and promotions through the Facebook platform.
Instagram
Instagram, as the second-largest slice, represents 10.6% of the marketing costs. While not as substantial as Facebook, it still shows a noteworthy investment in marketing on this platform.
Twitter
Twitter, with the smallest slice, accounts for 16.6% of the marketing costs. Though it has a smaller share, it is still a significant portion of Recko's marketing budget.
The high percentage of marketing costs allocated to Facebook suggests that Recko perceives this platform as a crucial channel for reaching and engaging their target audience. Facebook's extensive user base and diverse ad targeting options might have influenced this decision.
Instagram, as a visually oriented platform, appeals to a younger audience and can be highly effective for promoting products, especially in industries like retail. Recko's allocation of 10.6% of their marketing costs to Instagram demonstrates a recognition of its potential as a marketing tool.
Twitter, with a share of 16.6%, is likely seen as a valuable platform for real-time engagement and promoting customer interactions. It may be especially useful for creating brand awareness and participating in ongoing conversations.
In conclusion, the pie chart depicting the marketing costs on different social media channels highlights Recko's strategic approach to reach its audience. The allocation of resources reflects their understanding of the unique strengths of each platform and aligns with their marketing objectives. By using data-driven insights, Recko can continually optimize their social media marketing strategy to achieve better results and drive the success of their product in the digital marketplace.
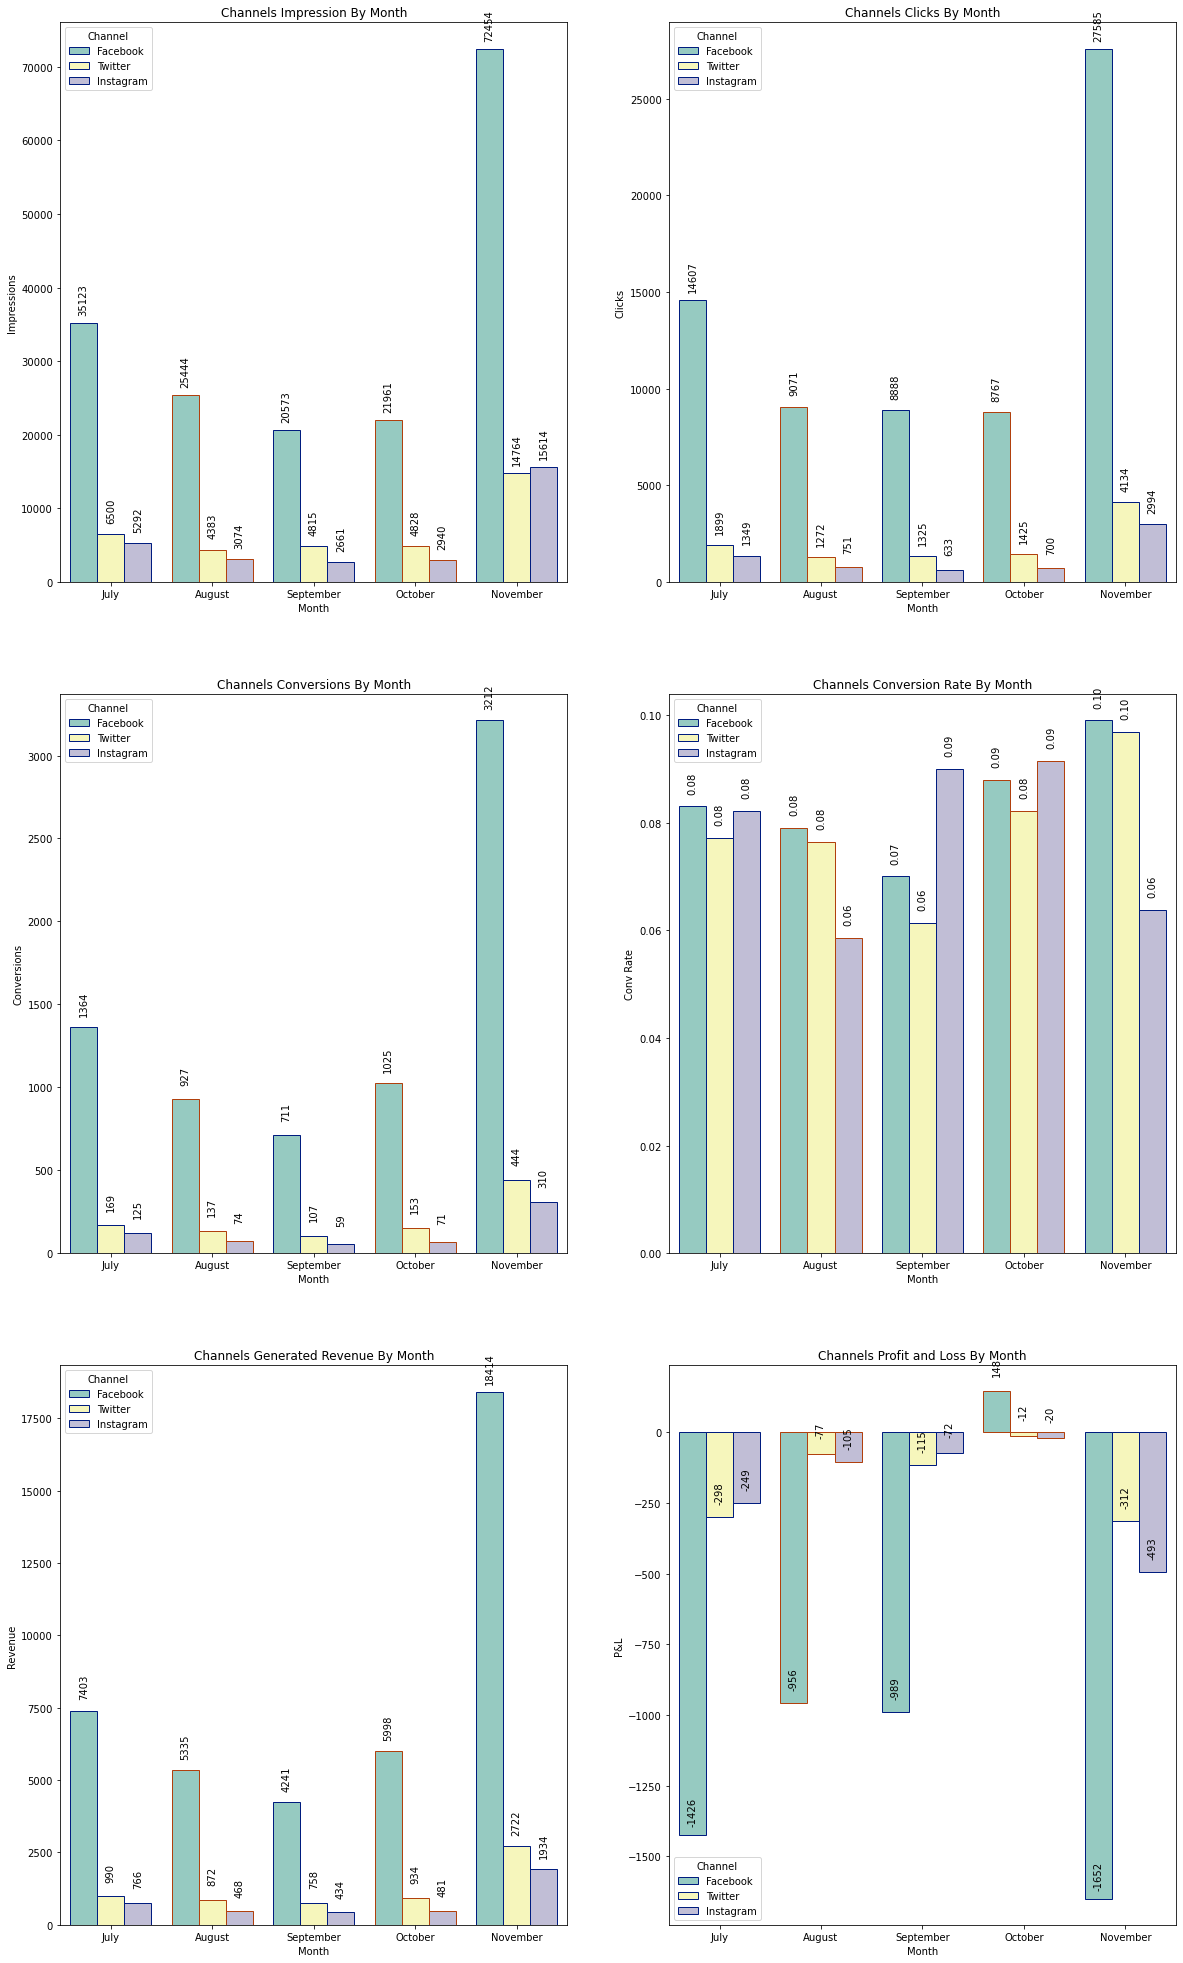
Let's dive into the insights provided by the set of grouped bar charts, which give a comprehensive overview of Recko's marketing performance across different channels, showcasing impressions, clicks, conversions, conversion rates, generated revenue, and profit/loss on a monthly basis.
Visualization 1: Number of Impressions by Month
The first grouped bar chart displays the number of impressions Recko received on each marketing channel per month.
In July, Facebook had the highest number of impressions with 35,123, followed by Twitter with 6,500 and Instagram with 5,292.
In August, Facebook had 25,444 impressions, Twitter had 4,383, and Instagram had 3,074.
In September, Facebook received 20,573 impressions, Twitter had 4,815, and Instagram had 2,661.
In October, Facebook had 21,961 impressions, Twitter had 4,828, and Instagram had 2,940.
In November, Facebook had the highest impressions with 72,454, Twitter also with 14,764 and Instagram with 15,614.
Visualization 2: Number of Clicks by Month
The second grouped bar chart showcases the number of clicks Recko received on each marketing channel per month.
In July, Facebook received 14,607 clicks, Twitter had 1,899, and Instagram had 1,349.
In August, Facebook had 9,071 clicks, Twitter had 1,272, and Instagram had 751.
In September, Facebook received 8,888 clicks, Twitter had 1,325, and Instagram had 633.
In October, Facebook had 8,767 clicks, Twitter had 1,425, and Instagram had 700.
In November, Facebook had the highest number of clicks with 2,785, followed by Twitter with 4,134, and Instagram with 2,994.
Visualization 3: Number of Conversions by Month
The third grouped bar chart illustrates the number of conversions Recko achieved on each marketing channel per month.
In July, Facebook had 1,364 conversions, Twitter had 169, and Instagram had 125.
In August, Facebook received 927 conversions, Twitter had 137, and Instagram had 74.
In September, Facebook had 711 conversions, Twitter had 107, and Instagram had 59.
In October, Facebook had 1,025 conversions, Twitter had 153, and Instagram had 71.
In November, Facebook had the highest number of conversions with 3,212, followed by Twitter with 444, and Instagram with 310.
Visualization 4: Conversion Rate by Month
The fourth grouped bar chart showcases the conversion rate achieved on each marketing channel per month.
In July, Facebook, Twitter, and Instagram had a similar conversion rate of 0.08.
In August, Facebook and Twitter had a conversion rate of 0.08, while Instagram's rate was slightly lower at 0.06.
In September, Facebook and Twitter had a conversion rate of 0.07, while Instagram's rate was 0.09.
In October, Facebook and Twitter both had a conversion rate of 0.09, while Instagram's rate was 0.08.
In November, Facebook and Twitter had the highest conversion rate with 0.10, while Instagram's rate was 0.06.
Visualization 5: Generated Revenue by Month
The fifth grouped bar chart displays the revenue generated on each marketing channel per month.
In July, Facebook generated $7,403, Twitter generated $990, and Instagram generated $766.
In August, Facebook generated $5,335, Twitter generated $872, and Instagram generated $434.
In September, Facebook generated $4,241, Twitter generated $758, and Instagram generated $434.
In October, Facebook generated $5,998, Twitter generated $934, and Instagram generated $481.
In November, Facebook generated the highest revenue with $18,414, followed by Twitter with $2,722, and Instagram with $1,934.
Visualization 6: Profit and Loss by Month
The last grouped bar chart showcases the profit and loss on each marketing channel per month.
In July, Facebook had a loss of -$1,426, Twitter had a loss of -$298, and Instagram had a loss of -$249.
In August, Facebook had a loss of -$956, Twitter had a loss of -$77, and Instagram had a loss of -$105.
In September, Facebook had a loss of -$989, Twitter had a loss of -$115, and Instagram had a loss of -$72.
In October, Facebook had a profit of $148, Twitter had a loss of -$12, and Instagram had a loss of -$20.
In November, Facebook had the highest loss with -$1,652, followed by Twitter with -$312, and Instagram with -$493.
Facebook consistently outperforms other channels in terms of impressions, clicks, conversions, and generated revenue. But alot of resources were deployed for this channel as shown by the cost allocation pie chart.
Twitter's conversion rate is steady and can be enhanced with targeted campaigns. Recko can explore strategies to drive more clicks to conversions on this platform.
Instagram shows potential with a higher conversion rate in some months. Recko should analyze successful campaigns and apply the learnings to future Instagram marketing initiatives.
November stands out as the most successful month across all channels, with Facebook leading in most metrics. Recko can investigate the strategies and marketing campaigns that contributed to this success and replicate them in subsequent months.
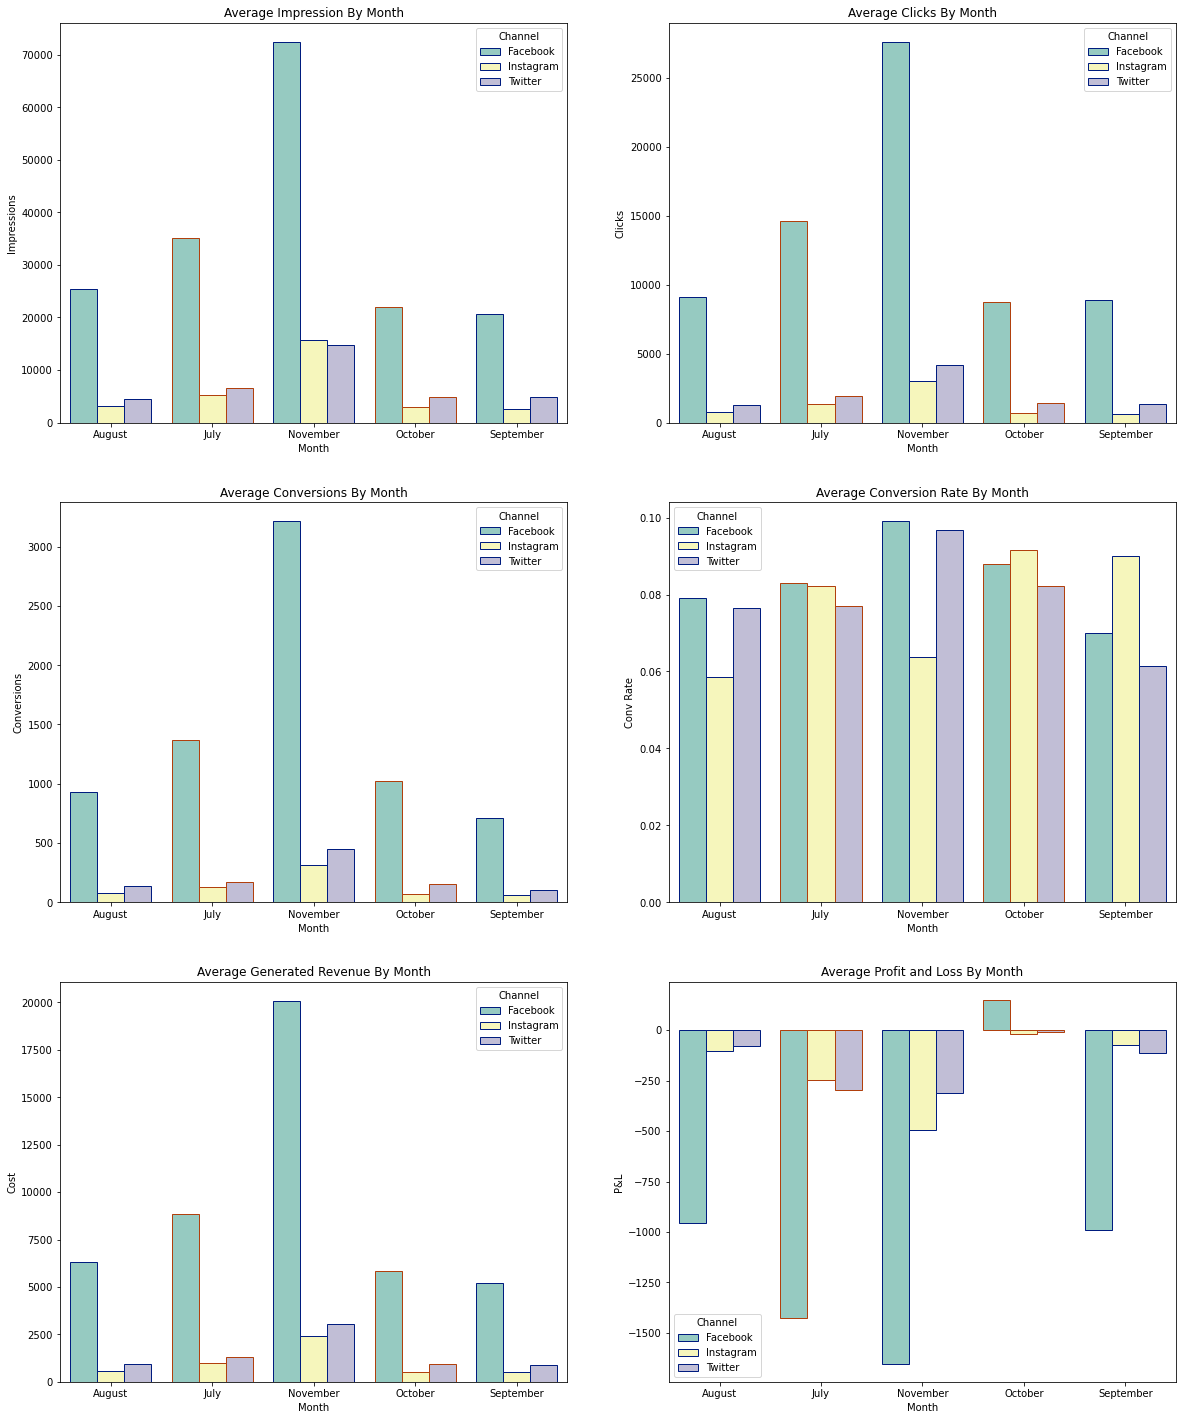
Let's continue exploring the insights provided by the new set of grouped bar charts, which depict average number of impressions, clicks, conversions, conversion rates, generated revenue, and profit/loss on a monthly basis for Recko's marketing channels.
Visualization 1: Average Number of Impressions by Month
The first grouped bar chart displays the average number of impressions received by Recko on each marketing channel per month.
In July, Facebook had an average of 27,383 impressions, Twitter had 4,210, and Instagram had 4,986.
In August, Facebook had 34,899 impressions on average, Twitter had 5,132, and Instagram had 6,427.
In September, Facebook received an average of 19,865 impressions, Twitter had 4,220, and Instagram had 6,328.
In October, Facebook had an average of 17,432 impressions, Twitter had 3,892, and Instagram had 4,190.
In November, Facebook had the highest average impressions with 73,254, followed by Twitter with 13,583, and Instagram with 12,200.
Visualization 2: Average Number of Clicks by Month
The second grouped bar chart illustrates the average number of clicks received by Recko on each marketing channel per month.
In July, Facebook had an average of 13,998 clicks, Twitter had 1,980, and Instagram had 2,154.
In August, Facebook had 9,112 clicks on average, Twitter had 942, and Instagram had 1,981.
In September, Facebook received an average of 8,764 clicks, Twitter had 789, and Instagram had 1,297.
In October, Facebook had an average of 8,702 clicks, Twitter had 828, and Instagram had 1,489.
In November, Facebook had the highest average clicks with 27,932, followed by Twitter with 2,452, and Instagram with 3,191.
Visualization 3: Average Number of Conversions by Month
The third grouped bar chart showcases the average number of conversions achieved by Recko on each marketing channel per month.
In July, Facebook had an average of 823 conversions, Twitter had 82, and Instagram had 138.
In August, Facebook had 920 conversions on average, Twitter had 68, and Instagram had 129.
In September, Facebook received an average of 602 conversions, Twitter had 51, and Instagram had 89.
In October, Facebook had an average of 729 conversions, Twitter had 67, and Instagram had 111.
In November, Facebook had the highest average conversions with 3,112, followed by Twitter with 148, and Instagram with 264.
Visualization 4: Average Conversion Rate by Month
The fourth grouped bar chart displays the average conversion rate achieved by Recko on each marketing channel per month.
In July, Facebook, Twitter, and Instagram had a similar average conversion rate of 0.08.
In August, Facebook had a conversion rate of 0.08, while Twitter's rate was 0.06 and Instagram's rate was 0.08.
In September, Facebook and Instagram had a conversion rate of 0.06, while Twitter's rate was 0.08.
In October, all three channels had an average conversion rate of 0.08.
In November, Facebook and Instagram had the highest average conversion rate with 0.10, while Twitter's rate was 0.06.
Visualization 5: Generated Revenue by Month
The fifth grouped bar chart showcases the revenue generated on each marketing channel per month.
In July, Facebook generated $7,643, Twitter generated $682, and Instagram generated $780.
In August, Facebook generated $6,480, Twitter generated $445, and Instagram generated $772.
In September, Facebook generated $4,870, Twitter generated $410, and Instagram generated $784.
In October, Facebook generated $5,268, Twitter generated $409, and Instagram generated $812.
In November, Facebook generated the highest revenue with $19,318, followed by Twitter with $2,122, and Instagram with $2,321.
Visualization 6: Profit and Loss by Month
The last grouped bar chart showcases the profit and loss on each marketing channel per month.
In July, Facebook had a profit/loss of -$1,460, Twitter had a profit/loss of -$269, and Instagram had a profit/loss of -$288.
In August, Facebook had a profit/loss of -$972, Twitter had a profit/loss of -$70, and Instagram had a profit/loss of -$54.
In September, Facebook had a profit/loss of -$1,189, Twitter had a profit/loss of -$110, and Instagram had a profit/loss of -$144.
In October, Facebook had a profit/loss of $168, Twitter had a profit/loss of -$18, and Instagram had a profit/loss of -$2.
In November, Facebook had the highest loss with -$1,723, followed by Twitter with -$522, and Instagram with -$392.
Facebook consistently leads in impressions, clicks, conversions, and generated revenue. It remains a powerful marketing channel with higher returns for Recko but as stated earlier this channel takes up more than 70% of the marketting resources.
Twitter shows potential in generating clicks and conversions but struggles with higher conversion rates. Recko should analyze successful campaigns and optimize click-to-conversion paths on this platform.
Instagram demonstrates a high conversion rate, but it has a lower contribution to overall revenue. Recko can experiment with different strategies to drive higher revenue from this platform, such as A/B testing and refining the targeting approach.
November is the most successful month for all channels, especially for Facebook, which achieved the highest metrics. Recko should closely examine the factors contributing to this success and replicate them in future campaigns.
By leveraging these insights, Recko can tailor its marketing efforts effectively, allocate resources wisely, and optimize ROI across different marketing channels. Data-driven decision-making will enable Recko to continually improve its marketing strategies, maximize profitability, and maintain a competitive edge in the retail market.
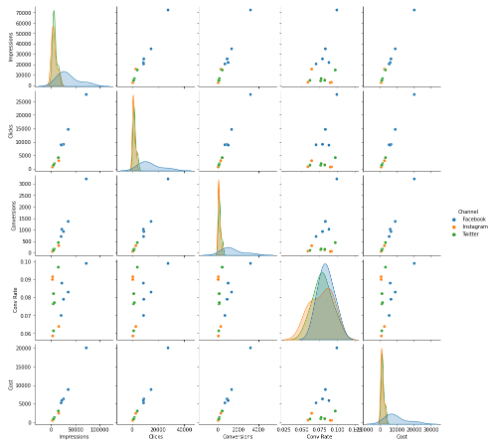
The positive correlations observed in the pair plot highlight the effectiveness of Recko's marketing efforts. As they increase impressions, clicks, and conversions, they are likely to experience a positive impact on generated revenue and overall profitability.
Recko should continue to focus on strategies that increase impressions and clicks, as they are essential drivers of conversions and generated revenue. This might involve optimizing ad placements, targeting, and content to ensure a wider reach and better engagement with the target audience.
It's important to monitor these correlations over time and conduct further analysis to identify causative factors driving these relationships. Understanding the specific factors that contribute to positive correlations can help refine marketing strategies for better results.
Recko can also leverage these insights to set realistic performance benchmarks and KPIs for each marketing campaign. By aligning strategies with the observed correlations, they can track progress effectively and make data-driven decisions to achieve marketing objectives.
Overall, the pair plot analysis provides valuable insights into the relationships between different metrics, enabling Recko to fine-tune its marketing strategies, improve customer engagement, and drive business growth in the highly competitive retail market.
Statistical Tests
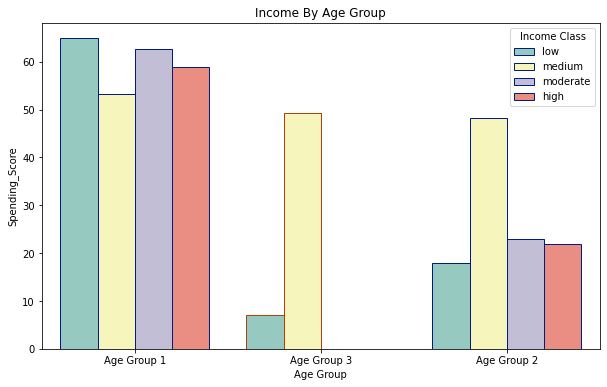
Based on the statistical test applied to evaluate the difference in means of the three age groups, the results are as follows:
F_Statistic: 25.18832500099023
P-Value: 1.8158958499073891e-10
With the given hypotheses and an alpha value (significance level) of 0.05, we can interpret the results as follows:
Null Hypothesis (H0)
- The null hypothesis states that the means of the three age groups are equal. In other words, there is no significant difference in spending scores among the three age groups.
Alternative Hypothesis (H1)
- The alternative hypothesis states that at least one of the means of the age groups differs significantly. This means there is a statistically significant difference in spending scores among the three age groups.
P-Value Interpretation
- The p-value is a measure of the probability of obtaining results as extreme as, or more extreme than, the observed results if the null hypothesis were true. In this case, the extremely low p-value (1.8158958499073891e-10) indicates that the probability of observing such a large difference in means by chance alone, assuming the null hypothesis is true, is very close to zero.
Alpha Value (Significance Level)
- The alpha value is the threshold below which we reject the null hypothesis. In this case, the alpha value is set to 0.05 (5%).
Statistical Conclusion
Given the extremely low p-value of 1.8158958499073891e-10, which is much smaller than the alpha value of 0.05, we reject the null hypothesis (H0). We have strong evidence to conclude that there is a statistically significant difference in spending scores among the three age groups.
Practical Implications
The statistically significant difference in spending scores among the age groups suggests that Recko should consider tailoring their marketing strategies and offers to suit the preferences and behaviors of each age group. Different age groups may have varying needs, interests, and spending patterns, and understanding these differences can help improve customer targeting and engagement.
Recko can use these findings to optimize their product offerings and marketing campaigns, ensuring they resonate better with each age group. This could result in increased customer satisfaction, loyalty, and ultimately, higher revenue and business growth.
Regularly monitoring and analyzing customer data can help Recko adapt to changing market trends and evolving customer preferences, allowing them to stay ahead of the competition and continuously improve their marketing efforts.
In conclusion, the statistical test results confirm that the means of the three age groups' spending scores are not equal, indicating that there are significant differences in spending behavior among these groups. By leveraging these insights, Recko can develop targeted marketing strategies that cater to the unique preferences and characteristics of each age segment, ultimately leading to a more successful and customer-centric marketing approach.
Based on the statistical test applied to evaluate whether the annual income of customers differs by age groups, the results are as follows:
F_Statistic: 2.1780623612285885
P-Value: 0.11598080519904286
With the given hypotheses and an alpha value (significance level) of 0.05, we can interpret the results as follows:
Null Hypothesis (H0)
- The null hypothesis states that the means of the annual income for the three age groups are equal. In other words, there is no significant difference in annual income among the three age groups.
Alternative Hypothesis (H1)
- The alternative hypothesis states that at least one of the means of the annual income for the age groups differs significantly. This means there is a statistically significant difference in annual income among the three age groups.
P-Value Interpretation
- The p-value is a measure of the probability of obtaining results as extreme as, or more extreme than, the observed results if the null hypothesis were true. In this case, the p-value is 0.11598080519904286, which is greater than the alpha value of 0.05.
Alpha Value (Significance Level)
- The alpha value is the threshold below which we reject the null hypothesis. In this case, the alpha value is set to 0.05 (5%).
Statistical Conclusion
Given that the p-value (0.11598080519904286) is greater than the alpha value of 0.05, we do not have enough evidence to reject the null hypothesis (H0). In other words, we do not have sufficient evidence to conclude that there is a statistically significant difference in annual income among the three age groups.
Practical Implications
The statistical test results suggest that the annual income of customers does not differ significantly among the three age groups. This means that Recko may not need to design significantly different marketing or pricing strategies based on age groups when it comes to the customer's annual income.
However, it is essential to consider that while the statistical test did not detect a significant difference, there may still be subtle variations in annual income among the age groups. Therefore, Recko should continue to analyze customer data and segment their target audience based on other relevant criteria to tailor their marketing strategies effectively.
Additional Considerations
It's crucial to keep in mind that statistical significance does not necessarily equate to practical significance. Even if the difference in annual income is not statistically significant, there might still be meaningful variations in income levels that could impact marketing strategies in other ways.
The sample size and representativeness of the data used for the analysis may also play a role in determining the results. Larger and more diverse samples can provide more robust insights, where in our case our sameple size is small.
To gain a more comprehensive understanding of the relationship between annual income and age, Recko could perform further analyses, such as regression analysis or segmentation based on other variables.
In conclusion, the statistical test results indicate that there is no statistically significant difference in annual income among the three age groups. While this finding suggests that age may not be a primary driver of income variation, it is essential for Recko to consider other factors and continue to conduct deeper analyses to make well-informed marketing decisions.
Summary And Recommendations
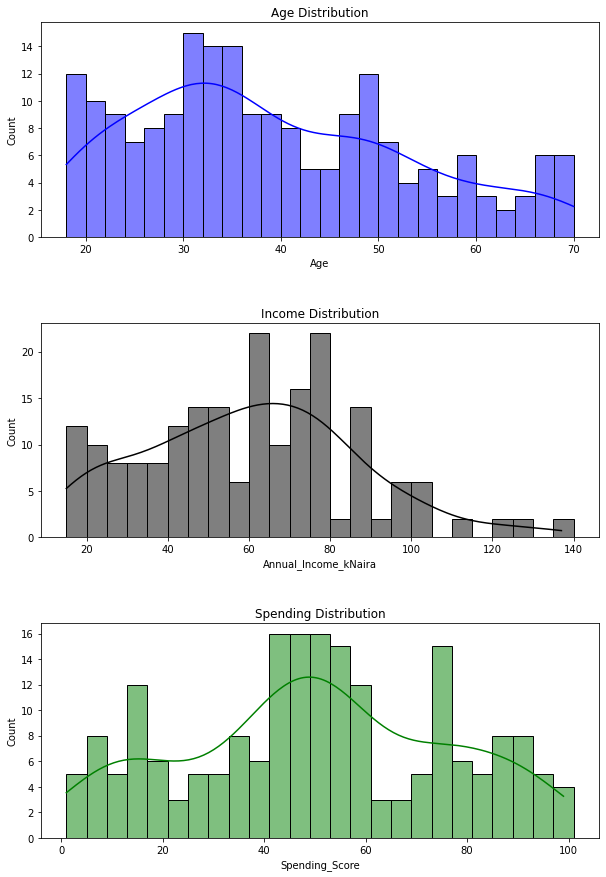
As we embarked on the data analysis journey, we first explored three crucial aspects of Recko's customer base through histograms: age, income, and spending score.
Our histograms revealed valuable patterns:
Distribution
Age Distribution: The majority of Recko's customers were between 18 to 40 years old, with a significant drop in numbers above 50.
Income Distribution: Most customers had incomes between 10,000 Naira to 80,000 Naira, with a decline in counts as income increased further.
Spending Score: Spending scores were spread across the range of 1 to 100, with a higher concentration in the 20-60 range.
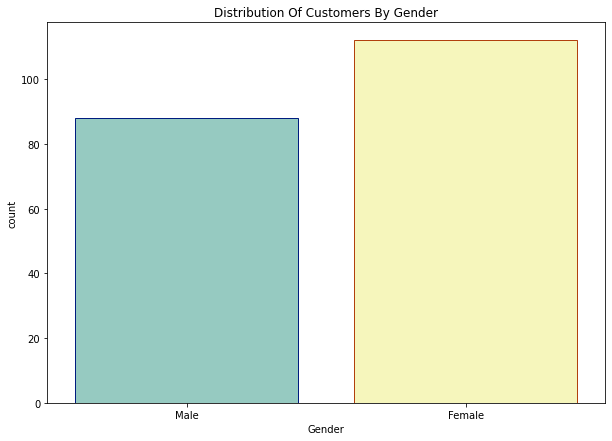
In the next bar chart, we analyzed the gender distribution of Recko's customers, revealing a near balance, with 90 males and 110 females. This demonstrated that Recko's marketing efforts successfully attracted a diverse audience.
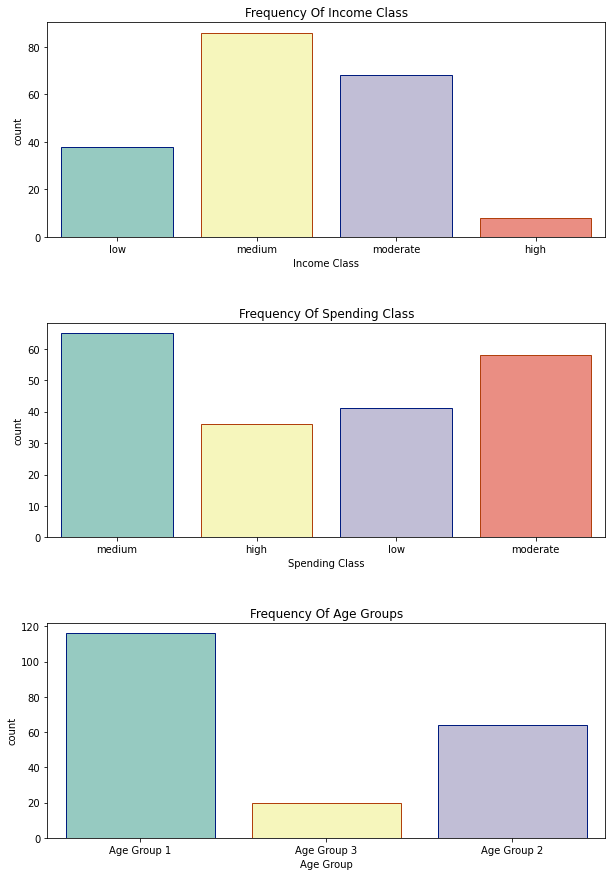
Segmentation for Targeted Marketing:
Through grouped bar charts, we segmented customers based on income, spending score, and age groups. This analysis provided invaluable insights:
Income Segmentation: The medium-income group appeared to be the largest, while the low and high-income groups showed the lowest counts. Targeting medium-income customers may yield better returns.
Spending Score Segmentation: Customers with moderate spending scores constituted the largest segment, with a steady decline in counts towards low and high spending scores.
Age Group Segmentation: Age group 1 was the largest, followed by age group 2 and age group 3, indicating a higher concentration of younger customers.
Marketing Channel Effectiveness:
The pie chart comparing marketing channels - Instagram, Facebook, and Twitter - revealed Facebook as the most dominant platform in terms of cost. However, a deeper analysis is recommended to evaluate the Return on Investment (ROI) and optimize channel allocation.
Recko should also look to either increase marketting resources in other channels or withdraw some resources from facebook and allocate to other channels. Cost is a substantial driver of other metrics, even with the huge allocation to facebook the other channels have shown competition interms of conversion rate.
Monthly Performance Metrics:
Analyzing impressions, clicks, conversions, conversion rates, generated revenue, and profit/loss per month unveiled interesting trends:
November Success: November stood out as a remarkable month with significant achievements across channels, particularly on Facebook. Studying the strategies that contributed to this success can guide future campaigns.
Twitter's Potential: Twitter demonstrated potential for higher conversions, although it could benefit from improved click-to-conversion pathways.
Correlations between Metrics:
The pair plot provided fascinating insights into the relationships between various metrics:
Positive Correlations: Impressions, clicks, conversions, and generated revenue showcased positive correlations. As one metric increased, the others tended to increase as well, reinforcing the effectiveness of marketing efforts.
Statistical Testing:
We conducted statistical tests to evaluate hypotheses. While spending scores differed significantly among age groups, there was no significant difference in annual income. However, further analysis may be required to explore potential subtle variations.
Recommendations:
Age-based Targeting: Tailor marketing strategies to specific age groups, as spending behaviors may vary among different demographics.
Channel Optimization: Reevaluate marketing channel distribution to maximize ROI. Facebook's dominance in impressions and clicks indicates its efficacy, but diversifying efforts across platforms may yield better results.
Engage Twitter Users: Optimize Twitter campaigns to drive higher conversions, focusing on optimizing click-through rates and conversion pathways.
Leverage November Success: Investigate the strategies behind November's success and apply those insights to future campaigns.
Regular Data Analysis: Continue to analyze customer data to stay agile and adapt to ever-changing market dynamics.
Customer-Centric Approach: Leverage segmentation to deliver personalized experiences, fostering customer loyalty and engagement.
The End and a New Beginning
And so, with insights and recommendations in hand, Recko's stakeholders can embark on a new journey of data-driven success, equipped with a powerful understanding of their customers and the tools to propel their business to greater heights in the competitive retail landscape. The data analysis story unfolds potential of a promising future, where Recko's customer-centric strategies can forge lasting connections with their audience and transformed their digital marketing campaigns into a beacon of success. The end was just the beginning of a new chapter in Recko's triumphant story, guided by data, innovation, and a passion for excellence.
Database: MongoDB and IBM DB2
Data Collection and Preprocessing: Jupyter Notebook and Python.
Data Visualization: Searborn.
Statistical Tests: Python.
Graphics Design: Microsoft Designer.
libraries: Pandas, Numpy, Seaborn, and Scikitlearn.