Insights

Frequency of Content Type:

The chart exhibits the abundance of different content types shared by vibrant community of users. As we traverse the bars, we witness the diversity of content that fills the platform. Unveiling the numbers, we observe that "Video" takes the lead, standing tall with an impressive value of 6245. "Photo" follows closely behind, boasting 6589 content pieces, while "GIF" and "Audio" secure their positions with 6079 and 5660 entries, respectively. This visual insight paints a vivid picture of the content landscape, emphasizing the significance of video and photo content on the platform.

Sentiment Distribution by Content Type:

Beyond the frequency, we delve deeper into the sentimentality of the content shared by users. The second chart, titled "Sentiment Distribution by Content Type," unravels the emotional journey of each content type. Venturing into the realms of video content, we encounter a captivating blend of emotions. "Positive" sentiments dominate the scene, with a staggering count of 3510, while "Neutral" sentiments hover at 792. Simultaneously, we acknowledge the existence of "Negative" sentiments at 1943, revealing the emotional spectrum that video content embodies. Glimpsing at the photo content, we witness a similar pattern of emotions. "Positive" sentiments once again steal the spotlight, soaring high at 3700, while "Neutral" sentiments hold steady at 832. Treading cautiously, we recognize the presence of "Negative" sentiments at 2057, intertwining vulnerability with the visual narratives shared by users. As we unravel the enchanting world of GIFs, a tale of sentiments unfolds. "Positive" emotions are a prevailing force at 3381, instilling the platform with joy and elation. "Neutral" sentiments keep stride at 774, while "Negative" sentiments whisper softly at 1924, gracefully coexisting with the animated stories weaved within each GIF. Lastly, we embrace the audio content, embracing the rhythms of emotions. "Positive" sentiments radiate warmth, resonating at 3216, while "Neutral" sentiments hum in harmony at 673. With resilience and grace, "Negative" sentiments find their voice at 1771, underscoring the depth of expression in the auditory treasures shared by users.

Insights

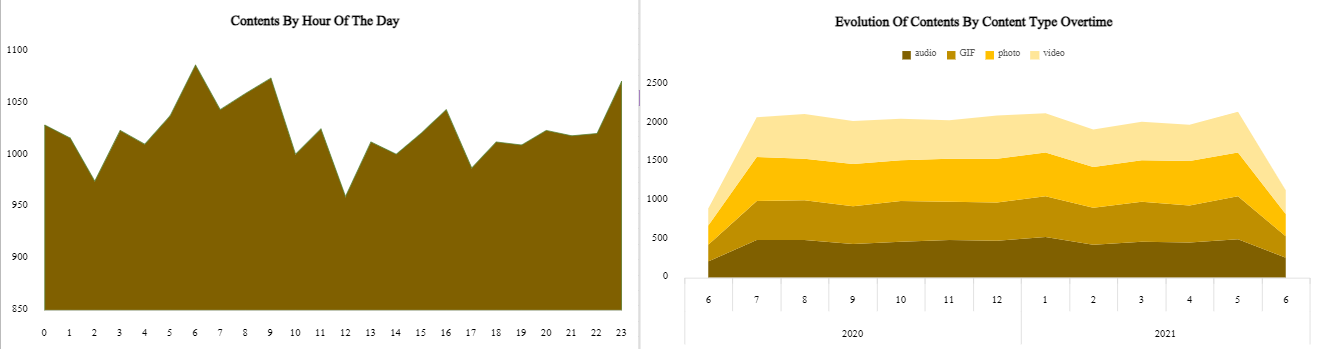
Embarking on the second leg of our data analysis journey, we set our sights on a duo of mesmerizing area charts that illuminate the rhythmic pulse of content on the platform. These visualizations resonate with the ebb and flow of time, unfurling captivating stories about content creation and user engagement.

Contents by Hour of the Day:

In the first area chart, "Contents by Hour of the Day," we embrace the passage of time and the content creations that color each hour. As the clock's hands sweep across the day, we witness the ebullience of user community, shaping the content landscape with every passing hour. At the dawn of the day, during the tranquil hours of 0:00 and 1:00, creativity takes flight with a gentle but significant pulse of 1025 and 1012 content pieces, respectively. With the rising sun, the vibrancy grows, and the hours of 2:00, 3:00, and 4:00 each carry a weight of 970, 1020, and 1010, adding to the dawn's symphony. As the day progresses, the content crescendo builds, reaching its peak during the morning hours. The sun-kissed hours of 6:00 and 7:00 embrace the new day with a flourish, contributing 1074 and 1032 content pieces, respectively. The energy remains high, with 1042 and 1062 content pieces flourishing at 8:00 and 9:00, mirroring the bustling rhythms of early-rising users. Midday unveils its own tempo, with 10:00 and 11:00 reflecting a steady stream of 982 and 1018 content pieces, respectively. The afternoon hours maintain the momentum, with 951, 1000, and 983 content pieces marking the cadence of 12:00, 13:00, and 14:00. As the sun begins its descent, we find solace in the familiar embrace of 15:00, 16:00, and 17:00, where 1020, 1027, and 965 content pieces unfurl, capturing the essence of the afternoon. With the twilight hours settling in, the content offerings linger with 969, 967, and 1001 content pieces blooming at 18:00, 19:00, and 20:00. As the night embraces the platform, the stars align with 999, 1000, and 1058 content pieces shining at 21:00, 22:00, and 23:00, illustrating the enduring allure of nocturnal creativity.

Evolution of Content Over Time:

The second area chart, "Evolution of Content by Content Type Over Time," captures the mesmerizing ebb and flow of content creation over the months. As we journey through time, we witness the collective crescendo of content types, painting a vivid tapestry of growth and engagement. Spanning from 2020 to 2021, the platform's content evolution unfolds in waves of creative expression. The cumulative contents per month sway like a rhythmic tide, swirling around the 2000 mark. January and May emerge as the zenith of this creative symphony, with content types soaring to their highest peaks. These months witness the culmination of our user community's innovative spirit, offering captivating content to our ever-engaged audience. On the contrary, April and February offer a tranquil interlude, where content ebbs slightly before resurging once more. These months find solace in nurturing the creativity that fuels our platform's growth.

Insights

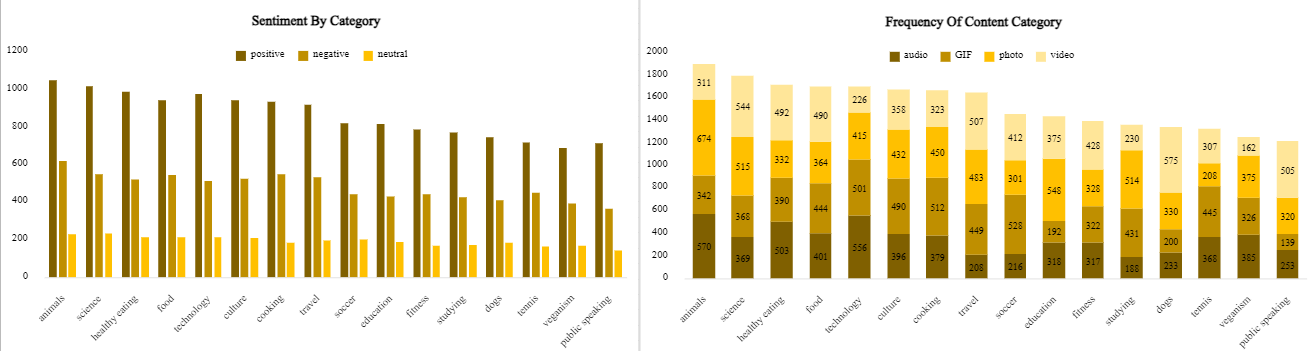
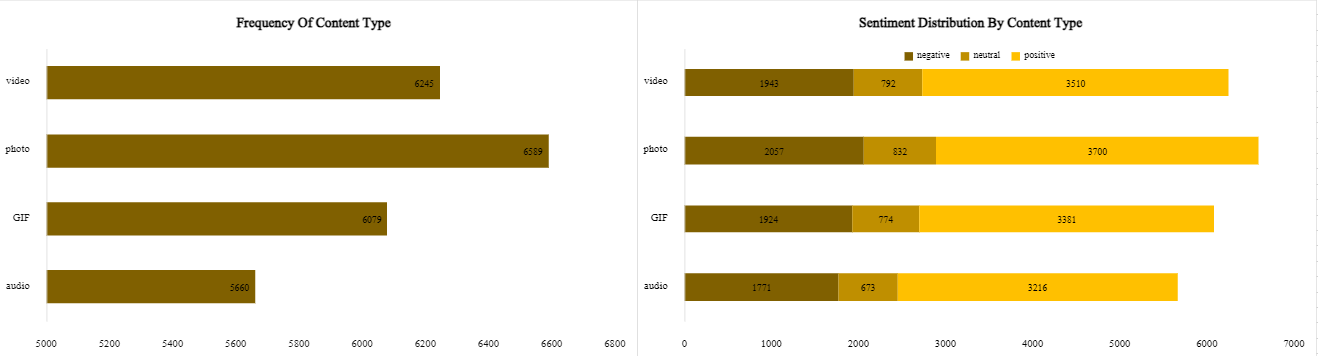
In this chapter of our data analysis journey, we immerse ourselves in a world of sentiments and content categories, unveiling the heart of the platform's user engagement. Two column charts grace the stage, painting vibrant stories of emotions and content creation.

Sentiment by Content Category:

The first column chart, "Sentiment by Content Category," reveals the emotional tapestry woven by users across different content categories. With each bar, we uncover the sentiments that resonate within the platform's diverse content landscape. Animal enthusiasts triumph in the realm of positive sentiments, with 1058 hearts filled with joy and appreciation. They bravely embrace 598 negative sentiments, while 201 neutral sentiments find their space amidst the fervor of animal-related content. Science explorers ride the wave of positivity, garnering 998 commendations from users. Balancing the equation, they welcome 572 negative sentiments, while 199 neutral sentiments offer a stable foundation to their content explorations. Healthy Eating advocates relish in the positivity of 982 sentiments, savoring the flavors of wellness. Alongside, they face 556 negative sentiments and receive solace in 191 neutral sentiments, nurturing their culinary journey. Food enthusiasts bask in the warm glow of 976 positive sentiments, savoring the flavors of culinary delights. They bravely navigate 568 negative sentiments, anchored by 190 neutral sentiments that embrace the diverse world of food. Technology aficionados find their stride amidst 980 positive sentiments, celebrating innovation and progress. With a daring spirit, they encounter 539 negative sentiments, seeking growth amidst 199 neutral sentiments. Culture admirers immerse themselves in the charm of 974 positive sentiments, cherishing the tapestry of traditions. They face 542 negative sentiments, while 193 neutral sentiments provide the harmony that unites cultural diversity.

Frequency of Content Category by Content Type:

In the second column chart, "Frequency of Content Category by Content Type," we venture deeper into the realm of content creation, unraveling the enchanting tapestry of content types across content categories. Animals lead the symphony of content creation, showcasing their creativity with 570 audio pieces, 342 GIFs, 674 photos, and 311 videos. Science enthusiasts craft their scientific tales with 369 audio pieces, 368 GIFs, 515 photos, and 544 videos, blending knowledge and imagination. Healthy Eating advocates share their culinary delights with 503 audio pieces, 390 GIFs, 332 photos, and 492 videos, nurturing both body and soul. Food lovers concoct gastronomic wonders with 401 audio pieces, 444 GIFs, 364 photos, and 390 videos, transforming meals into celebrations. Technology visionaries embrace innovation with 556 audio pieces, 501 GIFs, 415 photos, and 226 videos, building the foundations of the future. Culture enthusiasts breathe life into their cultural experiences with 396 audio pieces, 490 GIFs, 432 photos, and 358 videos, celebrating diversity.

Insights

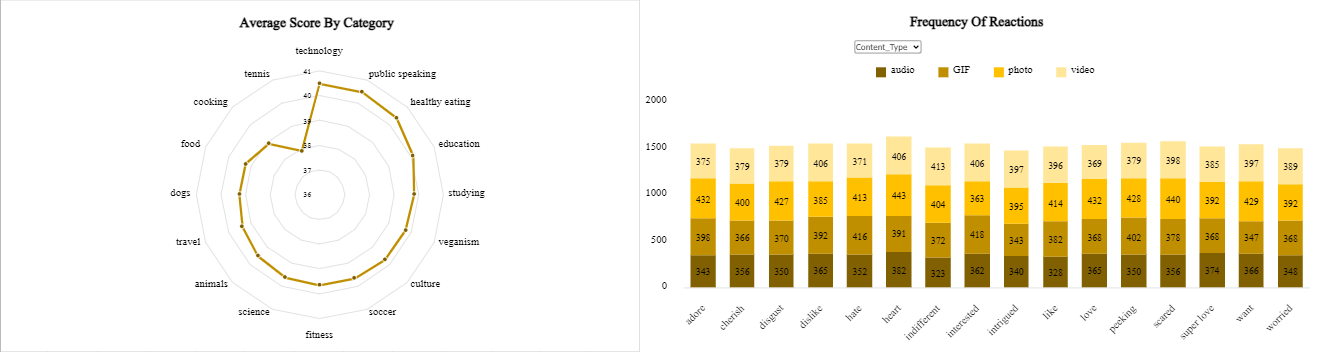
In this thrilling chapter of data exploration, we set sail into the depths of sentiments and reactions, uncovering the essence of user engagement on our platform. Two captivating visualizations, a radar chart and a stacked column chart, illuminate the emotions and reactions that define our content categories.

Average Score by Category:

The radar chart, "Average Score by Category," reveals the average sentiment scores across diverse content categories. As we traverse the radar, we encounter a range of emotions that define each category. Technology, Public Speaking, Healthy Eating, and Education gracefully occupy the 41-40 range on the radar, embracing an atmosphere of positivity and enthusiasm. Other categories are equally impressive, securing scores within the 40-39 range, standing as testament to the uplifting spirit and emotional resonance they evoke. However, Tennis and Cooking shine brightly with scores nestled within the 39-38 range, captivating their audiences with their distinct charms.

Frequency of Reactions by Content Category Types:

In the stacked column chart, "Frequency of Reactions by Content Category Types," we journey into the realm of reactions, where each emotion adds color and depth to content. Adore emerges as a potent force, with 343 audio reactions, 398 GIF reactions, 432 photo reactions, and 375 video reactions. This sentiment evokes an overwhelming sense of admiration and fondness. Cherish, with 356 audio reactions, 366 GIF reactions, 400 photo reactions, and 379 video reactions, embodies tender affection and endearment. Disgust manifests its impact with 350 audio reactions, 370 GIF reactions, 427 photo reactions, and 379 video reactions, stirring intense emotions of revulsion and aversion. Dislike, with 365 audio reactions, 392 GIF reactions, 385 photo reactions, and 406 video reactions, signifies a degree of dissatisfaction or opposition. Hate elicits 352 audio reactions, 426 GIF reactions, 413 photo reactions, and 371 video reactions, expressing strong negative sentiments. Heart, with 382 audio reactions, 391 GIF reactions, 443 photo reactions, and 406 video reactions, represents heartfelt emotions of love and connection. Indifferent reflects a balance with 323 audio reactions, 372 GIF reactions, 404 photo reactions, and 413 video reactions, signifying a neutral disposition. Interested entices with 362 audio reactions, 418 GIF reactions, 363 photo reactions, and 406 video reactions, expressing curiosity and engagement. Intrigued captivates with 340 audio reactions, 343 GIF reactions, 395 photo reactions, and 397 video reactions, stimulating intrigue and fascination. Like resonates with 328 audio reactions, 382 GIF reactions, 414 photo reactions, and 396 video reactions, conveying a sense of approval and appreciation. Love envelopes with 365 audio reactions, 368 GIF reactions, 432 photo reactions, and 369 video reactions, radiating boundless affection and adoration. Peeking intrigues with 350 audio reactions, 402 GIF reactions, 428 photo reactions, and 379 video reactions, arousing curiosity and interest. Scared evokes with 356 audio reactions, 378 GIF reactions, 440 photo reactions, and 398 video reactions, capturing feelings of fear and anxiety. Super Love enchants with 374 audio reactions, 368 GIF reactions, 392 photo reactions, and 385 video reactions, conveying intense and enthusiastic love. Want allures with 366 audio reactions, 347 GIF reactions, 429 photo reactions, and 397 video reactions, signifying desire and longing. Worried embraces with 348 audio reactions, 368 GIF reactions, 392 photo reactions, and 389 video reactions, expressing concern and apprehension.

Findings

Unveiling the Heartbeat of Our Platform

In the enchanting world of social media, our platform, "Social Buzz," pulses with life, connecting millions of users and fostering a vibrant community of content creators and explorers. As data analysts, we embark on a thrilling journey to unravel the heartbeat of the platform through a symphony of visualizations.
Frequency of Content Type: Users' creative expression knows no bounds, as evidenced by the "Frequency of Content Type" bar chart. Video and photo content reign supreme, captivating the audience with 6245 and 6589 entries, respectively. The allure of GIFs and audio content follows closely, resonating with the community at 6079 and 5660 pieces.
Sentiment Distribution by Content Type: Emotions and sentiments breathe life into the platform, painting a vivid emotional canvas through the "Sentiment Distribution by Content Type" bar chart. Across all content types, positivity is the prevailing sentiment, enriching the platform with joy and appreciation. "Negative" and "Neutral" sentiments add depth and complexity, infusing authenticity into the content narratives.
Contents by Hour of the Day: The "Contents by Hour of the Day" area chart showcases the rhythmic cadence of content creation throughout the day. From the tranquil hours of the early morning to the vibrant bustle of the afternoon, and into the captivating embrace of the night, users consistently share their creativity and stories. Each hour becomes a stage for expression, and the platform becomes a theater of content.
Evolution of Content Over Time: The "Evolution of Content by Content Type Over Time" stacked area chart portrays the sweeping journey of content creation, spanning from 2020 to 2021. Each month bears witness to the collective crescendo of content types, reaching their peak in January and May. Moments of tranquility surface in April and February before the platform resurges with renewed energy.
Sentiment by Content Category: The content categories are a diverse tapestry of emotions, as depicted in the captivating radar chart, "Average Score by Category." Categories like Technology, Public Speaking, Healthy Eating, and Education exude a warm aura of positivity and enthusiasm. Other categories thrive within the 40-39 range, while Tennis and Cooking shine brightly within the 39-38 range, weaving their unique magic.
Frequency of Reactions by Content Category Types: In the mesmerizing stacked column chart, "Frequency of Reactions by Content Category Types," we witness the spectrum of emotions that embellish our content. From expressions of Adore, Cherish, and Heart, to sentiments of Disgust, Hate, and Scared, each reaction adds depth to the tapestry of user engagement.
Comprehensive Insights: As data analysts, these visualizations reveal the heart and soul of the platform. We are a thriving ecosystem that thrives on creative expression, fueled by authentic emotions and connections. Users cherish video and photo content, while GIFs and audio content contribute their unique charms to the mix. Positivity resounds through every corner of the platform, enriching the user experience and fostering a sense of community. Throughout the day and across time, users share their stories, building a symphony of content that resonates with diverse audiences. Content categories, each imbued with its unique sentiments, offer an engaging canvas for user exploration. From Technology to Healthy Eating, each category sparks passion and curiosity in users. Embracing data-driven strategies, we will nurture and celebrate this thriving community. Armed with these insights, Social Buzz continue to curate an engaging and emotionally resonant platform, fostering connections that inspire, educate, and entertain.

Recommendations

As we prepare for the monumental milestone of the IPO, it's essential to leverage data-driven insights to fuel the growth and success of the company, Social Buzz. Based on the findings from the data analytics journey, here are comprehensive and detailed recommendations to propel the company towards sustainable growth and enhanced user experiences:
1. Content Diversity and User Engagement: Encourage users to explore and share a wide variety of content types, with a particular focus on videos and photos, which are most popular on the platform. Implement features that promote user interactions, such as comments and reactions, to foster deeper engagement and build a sense of community.
2. Emotional Connection and Sentiment Analysis: Continue to emphasize positivity and a sense of community within the platform, as positive sentiments dominate across content types and categories. Leverage sentiment analysis to better understand user preferences and sentiments, enabling personalized content recommendations for users.
3. Time of Content Creation: Recognize peak content creation hours, such as early morning and evening, and use this information to optimize content visibility and reach during these periods. Consider introducing themed content events or challenges during specific hours to encourage consistent engagement.
4. Content Category Enhancements: Invest in enhancing and promoting content categories with lower average scores, such as Tennis and Cooking, to drive more user engagement and interest. Collaborate with influencers or experts in these categories to curate and highlight compelling content.
5. User Reactions and Emotional Expression: Continuously monitor and analyze user reactions to understand the emotional impact of content, helping to create a richer emotional experience for the users. Use the insights from reactions to inform content curation, identify trending topics, and optimize the platform's algorithm.
6. Monetization Strategies: Develop and implement targeted advertising and sponsored content strategies, ensuring they align with the platform's values and user preferences. Explore premium features or subscription models to offer additional value to users and drive revenue diversification.
7. International Expansion: Assess data on content popularity and user engagement in different regions, identifying potential opportunities for international expansion. Tailor content categories and marketing efforts to suit the preferences and cultural nuances of specific target regions.
8. User Data Privacy and Security: Strengthen data security measures to protect user data and ensure compliance with data privacy regulations. Maintain transparent communication with users about data usage and ensure their trust in the platform.
9. Product Innovation and User Experience: Continuously innovate and enhance the platform's user interface and features to provide a seamless and enjoyable experience for users. Leverage emerging technologies, such as AI-driven content recommendations, to improve user satisfaction and retention.
10. Data-Driven Decision-Making: Establish a data-driven culture within the company, where data insights are integrated into decision-making processes at all levels. Foster a collaborative environment that encourages data sharing and insights across different departments. By implementing these comprehensive recommendations, Social Buzz can navigate the path to an IPO with confidence, armed with a data-backed growth strategy. As we celebrate the success of the IPO, The platform will continue to thrive, empowering users to connect, engage, and share their stories within the enchanting world of Social Buzz.

Tools And References

Database: Mysql
Data Collection and Preprocessing: Microsoft Excel.
Data Visualization: Microsoft Excel.